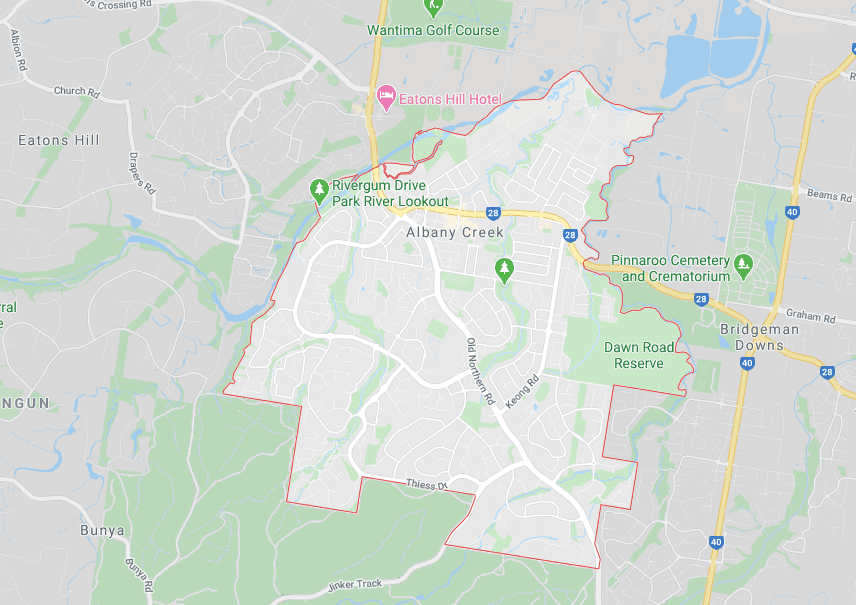
Albany Creek is located approximately 18.8 kilometres north-west of the City of Brisbane, Queensland, Australia, about a half-hour drive to the Brisbane central business district. It is positioned on a small hill which runs down to the South Pine River. Albany Creek is west of Bridgeman Downs and east of Eatons Hill. Cashs Crossing is a historic crossing point of the South Pine River. It takes its name from early settlers James and Mary Cash, who settled near the crossing point. South Pine Road now crosses the river at that point via a bridge.
Albany Creek is situated in the Yugarabul traditional Aboriginal country.
The suburb of Albany Creek was originally established on the intersection of two Aboriginal tracks. The main track formed the primary route north of Brisbane and is still known as “Old Northern Road”. The second track formed a route from Old Northern Road to Little Cabbage Tree Creek in Aspley and onto Downfall Creek in Chermside. Albany Creek Road and Gympie Road now follow this second route.
Albany Creek was originally known as Chinaman’s Creek before its name was changed in 1885 to honour the Duke of Albany.
Initially a rural area, Albany Creek began to develop as a suburban area in the 1960s as the Brisbane metropolitan area expanded. This led to the opening of more schools to cater for the growing population with Albany Hills State School opening on 30 January 1979, Albany Creek State High School opening on 25 January 1982
| Date | Median | Number of Sales in Suburb |
|---|---|---|
| 1993 | 139,500 | 220 |
| 1994 | 156,375 | 248 |
| 1995 | 145,000 | 191 |
| 1996 | 165,000 | 259 |
| 1997 | 162,500 | 329 |
| 1998 | 177,000 | 263 |
| 1999 | 179,600 | 397 |
| 2000 | 186,000 | 423 |
| 2001 | 202,750 | 508 |
| 2002 | 243,000 | 502 |
| 2003 | 302,500 | 393 |
| 2004 | 360,000 | 308 |
| 2005 | 366,000 | 363 |
| 2006 | 375,000 | 361 |
| 2007 | 435,000 | 362 |
| 2008 | 477,750 | 240 |
| 2009 | 480,000 | 289 |
| 2010 | 525,500 | 220 |
| 2011 | 475,000 | 198 |
| 2012 | 475,000 | 225 |
| 2013 | 500,183 | 244 |
| 2014 | 506,500 | 262 |
| 2015 | 560,000 | 235 |
| 2016 | 580,000 | 281 |
| 2017 | 579,000 | 231 |
| 2018 | 601,200 | 247 |
| 2019 | 618,000 | 203 |
| 2020 | 639,250 | 232 |
| 2021 | 810,000 | 269 |
| 2022 | 906,000 | 77 |
| Year | No. of Sales | Median | Growth | Low | High |
|---|---|---|---|---|---|
| 1993 | 220 | $139,500 | $55,000 | $290,000 | |
| 1994 | 248 | $156,375 | 12.1% | $65,000 | $340,000 |
| 1995 | 191 | $145,000 | -7.3% | $50,000 | $450,000 |
| 1996 | 259 | $165,000 | 13.8% | $55,000 | $330,500 |
| 1997 | 329 | $162,500 | -1.5% | $7,500 | $410,000 |
| 1998 | 263 | $177,000 | 8.9% | $60,000 | $1,089,000 |
| 1999 | 397 | $179,600 | 1.5% | $68,000 | $380,000 |
| 2000 | 423 | $186,000 | 3.6% | $68,000 | $436,500 |
| 2001 | 508 | $202,750 | 9.0% | $12,850 | $485,000 |
| 2002 | 502 | $243,000 | 19.9% | $19,000 | $910,000 |
| 2003 | 393 | $302,500 | 24.5% | $78,990 | $880,000 |
| 2004 | 308 | $360,000 | 19.0% | $80,000 | $2,000,000 |
| 2005 | 363 | $366,000 | 1.7% | $170,000 | $3,300,000 |
| 2006 | 361 | $375,000 | 2.5% | $212,000 | $935,000 |
| 2007 | 362 | $435,000 | 16.0% | $185,000 | $930,000 |
| 2008 | 240 | $477,750 | 9.8% | $317,500 | $1,375,000 |
| 2009 | 289 | $480,000 | 0.5% | $188,904 | $1,300,000 |
| 2010 | 220 | $525,500 | 9.5% | $325,000 | $1,350,000 |
| 2011 | 198 | $475,000 | -9.6% | $307,000 | $2,225,000 |
| 2012 | 225 | $475,000 | 0.0% | $296,000 | $900,000 |
| 2013 | 244 | $500,184 | 5.3% | $290,000 | $1,225,000 |
| 2014 | 262 | $506,500 | 1.3% | $315,000 | $1,500,000 |
| 2015 | 235 | $560,000 | 10.6% | $320,000 | $1,200,000 |
| 2016 | 281 | $580,000 | 3.6% | $320,000 | $2,100,000 |
| 2017 | 231 | $579,000 | -0.2% | $310,000 | $3,050,000 |
| 2018 | 247 | $601,200 | 3.8% | $320,000 | $1,925,000 |
| 2019 | 203 | $618,000 | 2.8% | $398,000 | $1,365,000 |
| 2020 | 232 | $639,250 | 3.4% | $410,489 | $1,200,000 |
| 2021 | 269 | $810,000 | 26.7% | $462,000 | $3,540,000 |
| 2022 | 77 | $906,000 | 11.9% | $595,000 | $1,950,000 |
| Response | Count |
|---|---|
| Under 800 | 870 |
| 800 to 999 | 280 |
| 1000 to 1249 | 342 |
| 1250 to 1499 | 328 |
| 1500 to 1749 | 315 |
| 1750 to 1999 | 316 |
| 2000 to 2499 | 684 |
| 2500 to 2999 | 506 |
| 3000 to 3499 | 359 |
| 3500 and over | 834 |
| Response | Count |
|---|---|
| < $800 | 314 |
| $800-$999 | 108 |
| $1000-$1399 | 279 |
| $1400-$1799 | 365 |
| $1800-$2399 | 642 |
| $2400-$2999 | 334 |
| $3000-$3999 | 249 |
| $4000+ | 91 |